Football is continuing to experience a rapid and remarkable surge of data analysis. Week after week, just as all elements of play are assessed by data scientists and coaching professionals, fans are bombarded with statistics before, during and after watching their teams.
With the likes of xG and heatmaps readily available to all, it could be considered a golden age for helping fans understand the beautiful game. However, there are a lot of useless stats and meaningless analysis floating around too.
The team at Football365 wanted to offer their readers stats that are not just more meaningful but also easy to access and easy to understand for all.
Sarah Winterburn, Editor at Football365 commented: “Football is more analytical than it has ever been, but a lot of the data available to the public is not actually that useful out of context, and it is regularly misused.
"But there are some great stats out there that we regularly go in search for to help inform our opinions, and what we wanted to do was bring all of that good stuff into one place - and add a fair bit of the stuff we always look for but can never find."
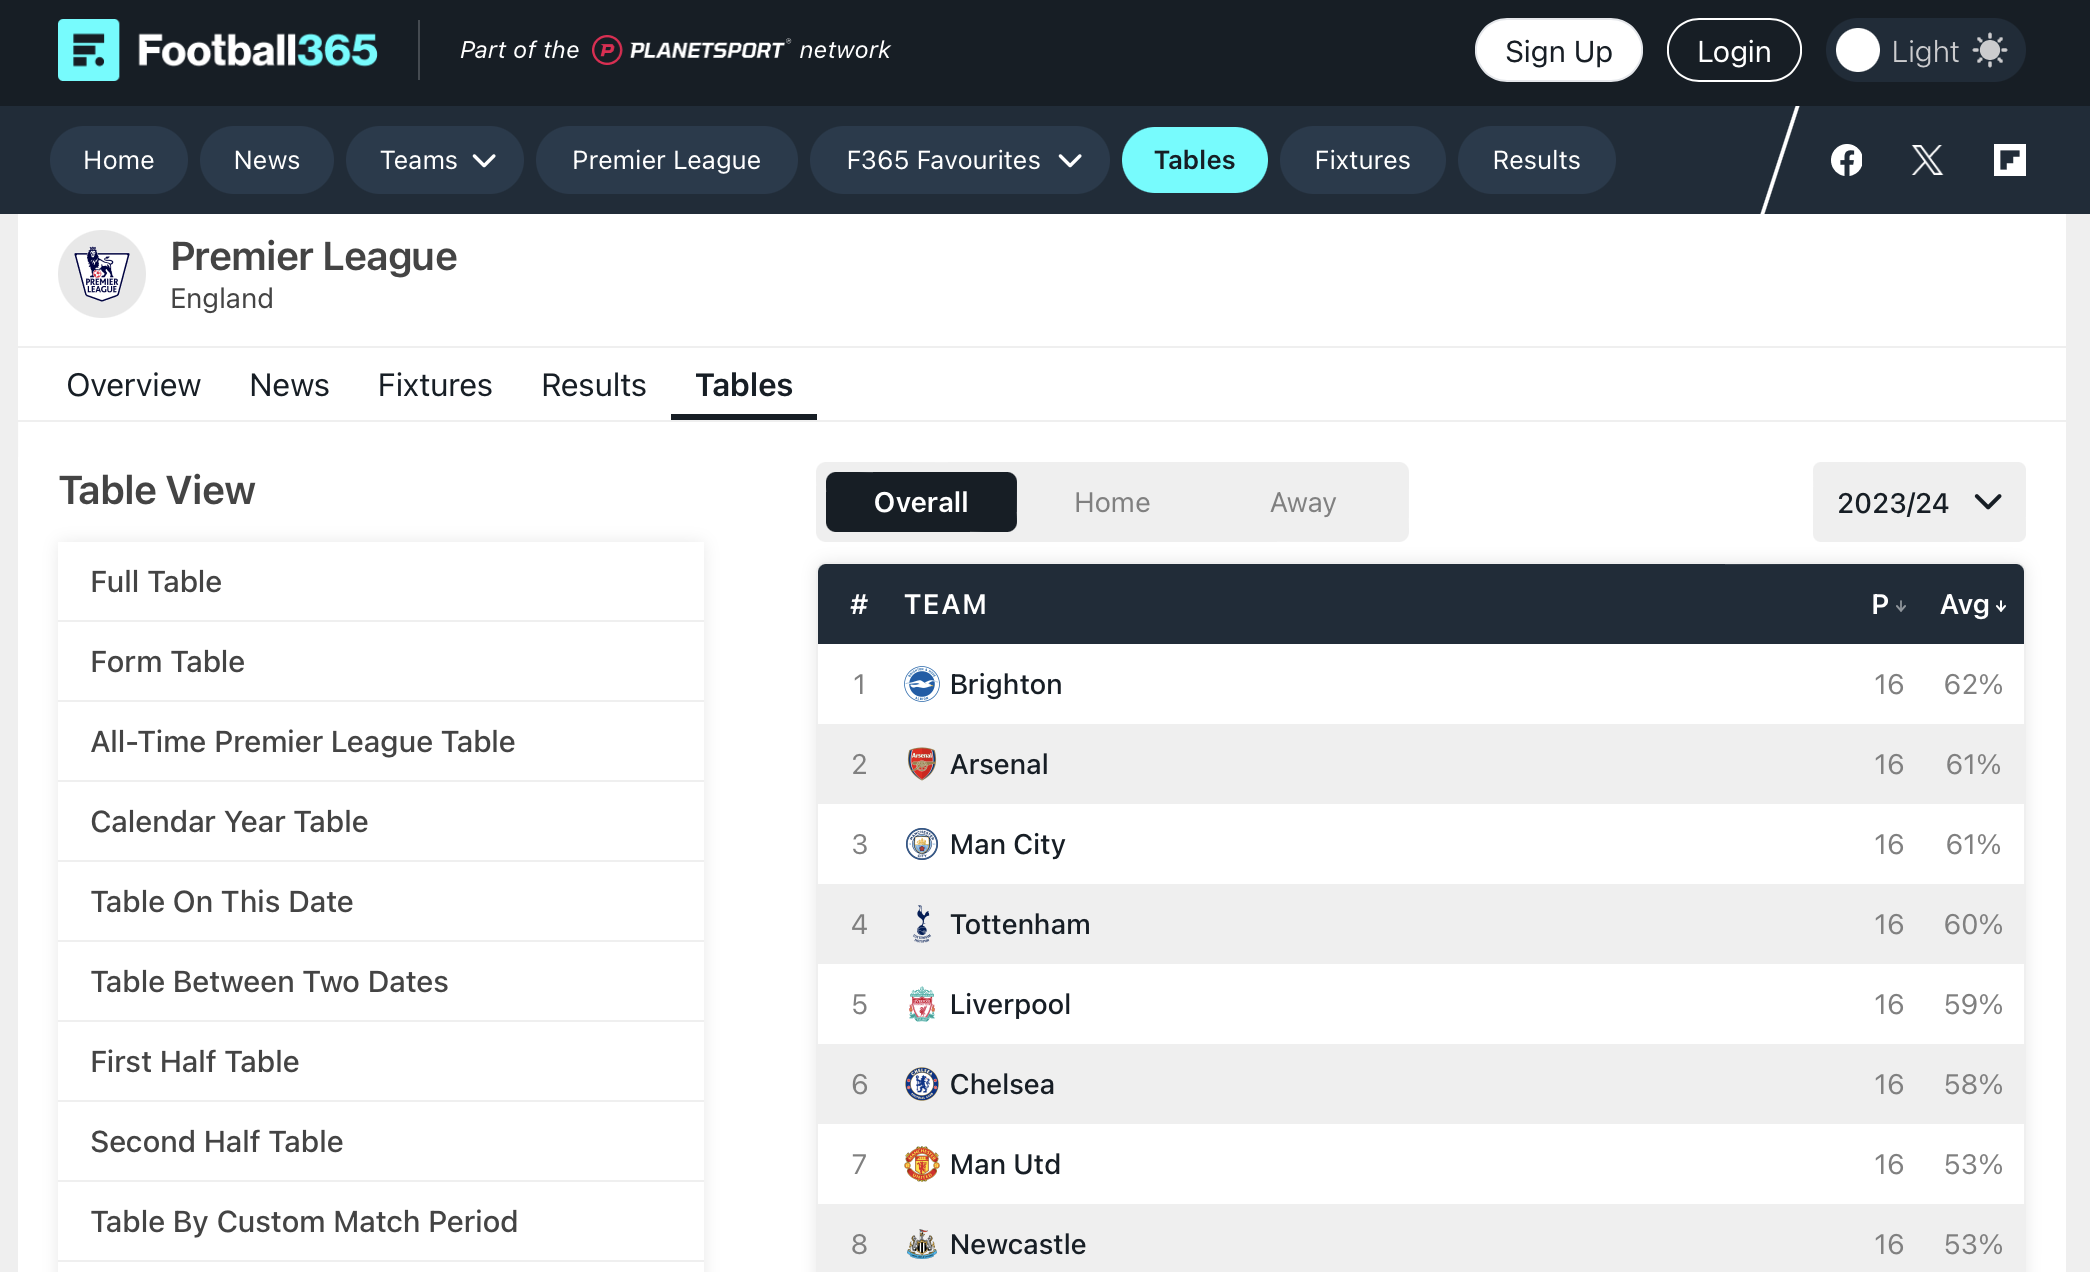
Football365’s innovative new multi-view tables deliver the raw data to help fans look at leagues in a whole new light. The new tables are perfect for settling a pub-based argument, helping inform a smart bet or simply grilling a rival about the points their team has lost from winning positions. The possibilities are endless.

Above: A look at Football365's new tables.
The responsive functionality ranks all Premier League clubs across 24 different categories, ranging from open play goals to both teams to score: invaluable insight for punters everywhere.
Fans may also dive into historic data going back as far as the inaugural Premier League season in 1992-93 and can even check how the table looked on any day in the preceding 31 years.
There are hours of fun to be spent for anyone who loves stats. Check out Football365’s new feature now.

